
With the recent action, Gold has made a strong push to the upside – with the metal running up to a tag of the 2203.00 figure (April, 2024 contract). While a short-term pullback is in force, the bigger uptrend is expected to remain intact in the coming weeks, before setting up the next correction of significance.
Gold Market, Short-Term
For the short-term picture, the action seen into early this week has seen some weakness, with that decline coming from the 10-day wave in the Gold market. Our market analysis tracks several individual waves, from 10 days – on up to a 310-day cycle.
The chart below shows the smallest of these waves, the 10-day component:
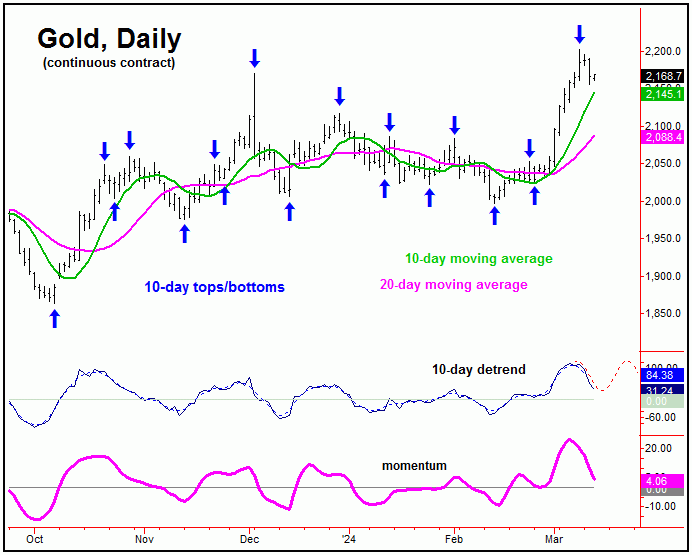
The above chart shows each of the past peaks and troughs for our 10-day wave, with the most recent high being the one registered on March 8th, doing so with the tag of the 2203.00 figure (April, 2024 contract).
With the action seen into early this week, the downward phase of this 10-day wave is likely in force, with the next short-term low expected to come from this cycle. Going further, the detrend indicator (middle pane) – along with the red dashed line – shows the approximate position of this wave in the past, and in the very near future.
Stepping back slightly, due to the position of the larger 72-day wave (more on this in a bit), the probabilities will favor the current short-term correction to end up as a countertrend affair, with first support around the 10-day moving average. If this path is correct, the next upward phase of the 10-day wave should take the metal back above the 2203.00 swing top into what looks to be the late-March to early-April timeframe.
Gold’s 72-day Cycle
Stepping back slightly, the next wave of significance is the 72-day cycle in Gold, which is shown on the following chart:
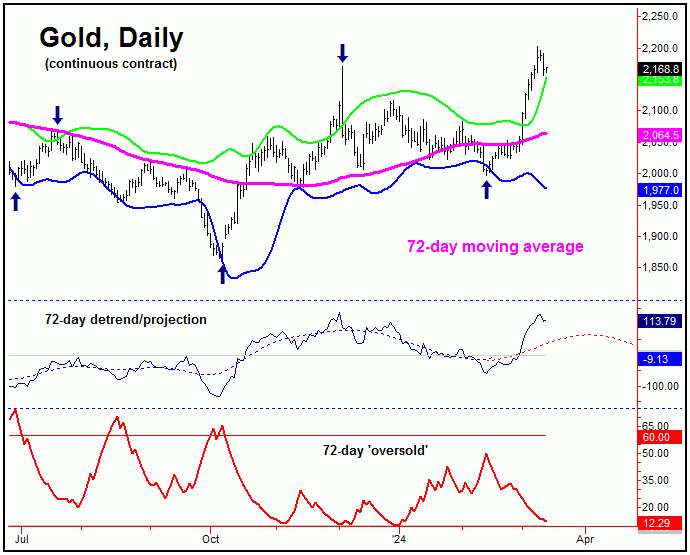
This 72-day wave was last projected to bottom into the late-January to mid-February timeframe, with its actual low coming in with the February 14th tag of 1996.40 (April, 2024 contract).
In our Gold Wave Trader market report, we use what I call ‘reversal points’, which are key price levels, designed to tell us when any particular wave has changed direction from down to up (or vice versa).
With that, we recently noted the upside ‘reversal point’ for this 72-day wave as being the 2085.60 figure (April, 2024 contract). In other words, once that level was broken above, that triggered in the upward phase of this wave to be back in force – resulting in the recent ‘catapult’ move to the upside.
Going further with the above, we also analyze patterns on the various waves that we track, keeping a detailed analysis on the approximate time and price statistics for each – which can give us good clues on what to expect in the near future.
With the above, I mentioned in our Gold Wave Trader report, that taking out the 2085.60 figure to the upside was the trigger for a 10-14% rally for Gold, which targeted a test of the 2195 (minimum) to 2270 level. The lower-end of this range has obviously been met with the action that followed.
In terms of time, however, the average rally phases with this 72-day wave have lasted around 39 trading days before peaking, which suggests its current upward phase will push higher into the early-April timeframe – before turning back for another correction phase into May.
All said then, the overall assessment is looking for the current short-term correction phase (10-day wave) to end up as countertrend, to be followed by higher highs on the next swing up. On or after early-April, the metal will then be set for the next decline of significance, expected to come from the bigger 72-day component.
Gold’s Bigger Picture
For the mid-term picture, the biggest cycle that is dominant in the Gold market is the 310-day wave, which is shown on our next chart:
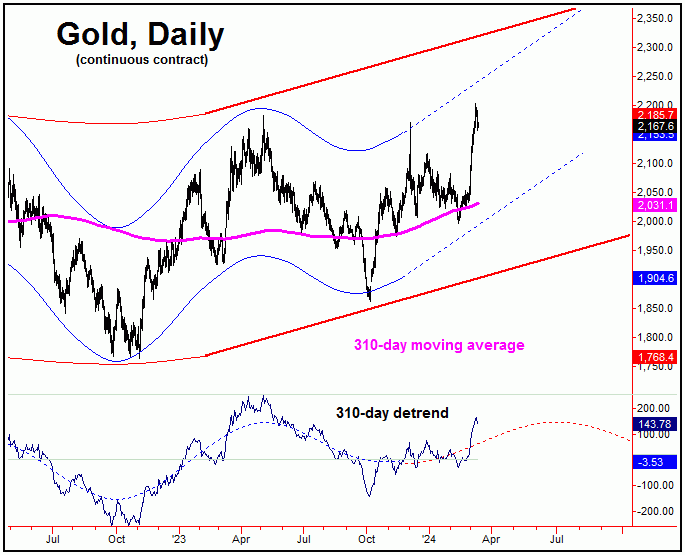
The last low for this 310-day wave was the October, 2023 bottom of 1862.90, which was confirmed to be the case very early in the cycle. I mentioned (at that time) that Gold had the potential to reach up to the 2270’s or better, simply due to the fact that the average rallies with this cycle had been in the range of 20% or more.
In terms of time, the upward phase of this 310-day wave is projected higher into the late-Spring to mid-Summer, 2024 timeframe. Going further, the position of this cycle offers up some predictability with the smaller 72-day wave, in that it tells us to expect the next downward phase of that cycle to end up as another countertrend affair, to be followed by higher highs into this Summer.
For the bigger picture, once we get into the Summer of this year, Gold will be looking for its next 310-day cycle top. Once this wave does peak, a larger percentage decline would be expected to play out in the following months, a decline similar to the one seen from the May, 2023 peak into October, 2023 bottom – which was the last peak-to-trough phase with this 310-day component; stay tuned.
Jim Curry
The Gold Wave Trader
Market Turns Advisory
http://goldwavetrader.com/
http://cyclewave.homestead.com/